How to Trade the On Neck Candlestick Pattern for Consistent Results
Aug 27, 2024 By Elva Flynn
In trading, understanding and interpreting candlestick patterns can give you an edge. Among these patterns is the On Neck candlestick pattern, a relatively lesser-known but powerful signal often seen in trending markets. Unlike some of the more complex formations, the On Neck pattern is straightforward to spot and can be highly effective when used correctly. In this article, well delve into what this pattern represents, how it can be interpreted, and how you can effectively incorporate it into your trading strategy.
What Is the On Neck Candlestick Pattern?
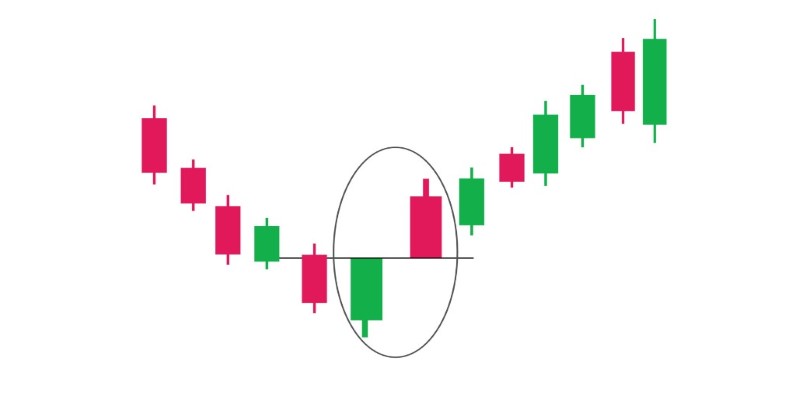
The On Neck candlestick pattern is a two-candle formation that typically signals a continuation of a prevailing trend. It is often observed during bearish trends but can also be relevant in bullish scenarios. The pattern gets its name from its appearance, where the closing price of the second candle rests on the same level as the first candle's closing or very near it, resembling something resting on the neck of the first candle.
In most cases, this pattern is categorized as a bullish continuation pattern in downtrends. When it appears, it suggests that the bearish momentum might be slowing down, and a bullish reversal or a trend continuation is likely.
Anatomy of the On Neck Pattern
The On Neck pattern consists of two distinct candlesticks:
First Candle (Strong Candle): The first candle is typically a large bearish candle that reflects significant downward momentum. It shows that the bears are firmly in control and driving the price lower.
Second Candle (Smaller Candle): The second candle is a smaller bullish or bearish candle, closing at or near the same level as the first candle's close. The key characteristic is that it doesnt completely overlap or engulf the first candle. The body is smaller, indicating indecision in the market.
While the first candle signals strong bearish control, the second candles inability to push lower indicates that the sellers might be losing strength. The close at a similar level can hint at a possible reversal or continuation depending on the overall trend.
Trading the On Neck Pattern in Different Market Contexts
The On Neck candlestick pattern offers useful insights, but its effectiveness varies depending on market conditions. Heres how to approach this pattern across bearish, bullish, and ranging trends.
Bearish Trend
In bearish markets, the On Neck pattern typically signals a continuation of the downward trend. This pattern is most reliable when it appears after a sustained decline. It generally consists of a strong bearish candle followed by a smaller candle that closes near or at the previous close, indicating that sellers are temporarily losing momentum. However, this pattern doesnt always indicate a reversal; instead, it often suggests a brief pause before the downtrend continues.
Traders usually confirm this continuation by waiting for the price to break below the low of the pattern. Once confirmed, entering a short trade with a stop-loss above the high of the second candle is a common strategy. This allows traders to capitalize on further bearish momentum while managing risk effectively.
Bullish Trend
Although less common, the On Neck pattern can also appear in bullish trends, usually indicating brief consolidation before the trend resumes. This scenario typically consists of a strong bullish candle followed by a smaller bearish candle that closes near the previous low. This pattern suggests temporary resistance rather than a trend reversal.

For bullish trades, waiting for a breakout above the high of the first candle is crucial. If the price moves upward, it signals that buyers have regained control, making it a good entry point for long trades. A stop-loss placed below the low of the smaller candle helps protect against unexpected reversals.
Ranging Markets
In ranging or sideways markets, the On Neck pattern is less reliable due to the lack of a clear trend. Price often oscillates within a set range, making the pattern prone to false breakouts. When trading in such conditions, its best to focus on patterns forming near key support or resistance levels, as these provide more reliable signals.
However, many traders avoid using this pattern in ranging markets altogether, as it performs better in trending environments where the pattern aligns with the overall momentum.
Pros and Cons of the On Neck Candlestick Pattern
Understanding the strengths and limitations of the On Neck candlestick pattern is essential for applying it effectively in trading. Heres a breakdown of the key pros and cons associated with this pattern:
Pros Of Neck Candlestick Pattern
Simplicity and Ease of Identification: The On Neck pattern is relatively easy to spot on a price chart. With only two candles involved, traders can quickly recognize it without needing extensive analysis. This simplicity makes it suitable even for beginners.
Reliable in Trending Markets: When used within strong trending markets, especially in bearish conditions, the On Neck pattern can be a reliable signal for spotting potential trend continuations. Its often seen as an indication of a temporary pause before the trend resumes, making it useful for timing entries.

Supports Risk Management: The pattern's straightforward structure allows traders to set clear entry and exit points. Stop-loss orders can be placed just below the low of the first candle in a bearish scenario or above the high in a bullish scenario. This clarity enhances risk management, helping traders protect their capital.
Cons On Neck Candlestick Pattern
Limited Strength as a Standalone Signal: The On Neck pattern on its own is not a very strong indicator. It often requires additional confirmation from other indicators or price action analysis. Trading solely based on this pattern without further context can lead to poor decisions and false signals.
Less Effective in Choppy or Sideways Markets: This pattern is most effective in trending markets. In choppy or sideways markets, the pattern can appear frequently without offering any meaningful insight into the markets direction, leading to potential whipsaws and losses.
Not a Strong Reversal Signal: While the On Neck pattern can occasionally suggest a reversal, it is more commonly a continuation pattern. Traders looking specifically for strong reversal signals might find this pattern less useful compared to more definitive formations like the Hammer or Bullish/Bearish Engulfing patterns.
Conclusion
The On Neck candlestick pattern is a versatile and valuable tool for traders, especially when used in conjunction with other technical indicators and market analysis. Whether in a bullish or bearish trend, the pattern can help you spot potential continuations or reversals, giving you an edge in making informed trading decisions.
Remember that no single pattern should be used in isolation. Always consider the broader market context, combine multiple signals, and employ sound risk management practices. By mastering the On Neck pattern and understanding its nuances, you can add another effective strategy to your trading toolkit, improving your chances of consistent success in the markets.

Is Your Commute 'Extreme'? Here’s What It’s Really Costing You

S Corp vs C Corp: Simplified Guide to Choosing the Right Corporate Structure

How to Invest in Knowles Corporation Stock?

Greenwood Review: Spending and Savings
HSBC to challenge Revolut and Wise with new forex app

Starlink IPO Date: Everything We Know So Far

Why Do Wealthier Students Receive More Help Than Others

Understanding Actuarial Life Table: A Simple Guide

Uncovering a Key Tax Acronym: What You Need to Know