Trading Forex with Kagi Charts: A Practical Guide for Consistent Profits
Aug 26, 2024 By Vicky Louisa
Forex trading is fast-paced, with fluctuating prices making trend identification essential. The Kagi chart, a lesser-known tool originating in Japan, offers a unique approach. Initially used for tracking rice prices, it has become valuable across markets, including Forex. Unlike traditional charts, Kagi charts focus on price movements and disregard time intervals, highlighting key trend shifts, breakouts, and reversals. This article explores how to effectively trade Forex using Kagi charts, providing insights for refining your trading strategy.
Understanding Kagi Charts
Before we get into the trading strategies, its essential to understand how Kagi charts work. A Kagi chart consists of a series of vertical lines connected by horizontal lines. These lines change direction based on price movements and thicken or thin depending on the strength of the trend. The thick line is often referred to as the "yang" line, indicating bullish momentum, while the thin line is called the "yin" line, indicating bearish momentum.
What makes Kagi charts unique is that they only change direction when the price reaches a reversal threshold, which is usually a pre-set percentage or a fixed amount, known as the "reversal amount." This feature filters out minor price movements, allowing traders to focus on significant trend changes. As a result, Kagi charts are particularly useful for trend-following strategies in volatile markets like Forex.
Setting Up Kagi Charts for Forex Trading
To trade effectively using Kagi charts, you need to set them up properly. Most modern trading platforms, like MetaTrader 4 or TradingView, offer Kagi chart options. The key is to configure the reversal amount accurately, as it directly impacts the charts sensitivity to price movements.
Choosing the Reversal Amount

For Forex trading, the reversal amount is often set as a percentage of the price or in terms of pips (e.g., 10, 20, or 50 pips). A smaller reversal amount will make the chart more sensitive, showing more frequent reversals, while a larger amount will smooth out minor fluctuations, focusing on significant trends. If you are a short-term trader, a smaller reversal amount might be more suitable, whereas long-term traders usually prefer a larger setting.
Adjusting Time Frames
Although Kagi charts are not time-based, choosing the right timeframe for your analysis can still be important. The 4-hour and daily charts are popular among Forex traders as they provide a balanced view between short-term volatility and long-term trends.
Trading Strategies Using Kagi Charts
Once your chart is set up, you can employ several strategies to trade Forex effectively using Kagi charts. Here are a few approaches you might consider:
Trend-Following Strategy
Kagi charts are inherently trend-following tools, making them ideal for this type of strategy. When the chart switches from a yin (thin) line to a yang (thick) line, it indicates a potential bullish trend. Conversely, when the line changes from yang to yin, it suggests a bearish trend.
To execute this strategy, wait for the line to change its thickness as a confirmation of the trend. You can then enter a long position when a yang line appears or a short position when a yin line appears. This strategy works well in markets with strong momentum but is less effective in choppy, sideways markets.
Support and Resistance Breakouts
Another effective method for trading with Kagi charts is identifying support and resistance levels. Since Kagi charts emphasize significant price reversals, they can help you spot when the price is about to break a key level. For example, if a Kagi line changes direction near a known support or resistance level, it may indicate that a breakout is imminent.
In this scenario, you can place your trades based on the direction of the breakout, setting your stop loss just below the support or above the resistance to manage risk.
Reversal Trading

Kagi charts are also great for spotting reversals, particularly in trending markets. If you notice that the chart has been consistently printing yang lines and suddenly flips to a yin line (or vice versa), this could be a sign of an impending reversal. Reversals often present excellent entry points, particularly if you catch them early. However, be cautious and look for additional confirmation through other indicators like RSI (Relative Strength Index) or MACD (Moving Average Convergence Divergence).
Risk Management and Limitations of Kagi Charts in Forex Trading
Kagi charts offer a unique way to visualize price action in forex trading, but effective risk management and awareness of their limitations are crucial for consistent success.
Risk Management When Using Kagi Charts
No trading strategy is complete without robust risk management. Since Kagi charts focus on trend strength and price direction, they offer an intuitive way to set stop-loss levels and manage trades.
Stop-Loss Placement: One effective technique is to place your stop-loss order just above or below the most recent line reversal. If the price moves against your position and triggers a new reversal, its a clear sign that the trend has shifted.
Position Sizing: Kagi charts can be used in conjunction with position sizing strategies. If the chart indicates a strong trend (e.g., multiple yang lines in a row), you can consider increasing your position size to maximize gains. On the other hand, if the trend appears weak or choppy, scaling down your position size reduces risk.
Limitations of Kagi Charts in Forex Trading
While Kagi charts offer many advantages, they are not without their limitations. Here are a few you should keep in mind:
Lagging Nature: Like most trend-following tools, Kagi charts can lag behind actual price movements. The reversal threshold can sometimes cause you to miss the ideal entry or exit point, especially in rapidly moving markets.
Difficulty in Sideways Markets: Kagi charts work best in trending environments. In sideways or range-bound markets, the frequent reversals can lead to false signals, making profiting difficult.
Learning Curve: Although they simplify trend identification, Kagi charts can be challenging for traders new to this type of analysis. Understanding how to set the reversal amount and interpret the lines effectively requires practice.
Conclusion
Kagi charts offer a unique and effective way to trade Forex, especially for those looking to simplify their analysis and focus on price trends rather than time intervals. By filtering out minor fluctuations, these charts allow traders to zero in on significant price movements, making them well-suited for trend-following strategies and breakout trading. However, like any tool, they are not foolproof and require a solid understanding of the market combined with disciplined risk management.

Understanding the Role of a Business Consultant: A Comprehensive Guide

Bank Guarantee vs Letter of Credit: Understanding the Differences

Greenwood Review: Spending and Savings

Starlink IPO Date: Everything We Know So Far

A Beginner's Review To Southern Farm Bureau Auto Insurance

Green Dot Credit Cards Demystified: 8 Key Points You Should Be Aware Of
Umar Ashraf: Founder of TradeZella and His Vision for the Future

Boosting Insight-Driven Digital Engagement at FIs
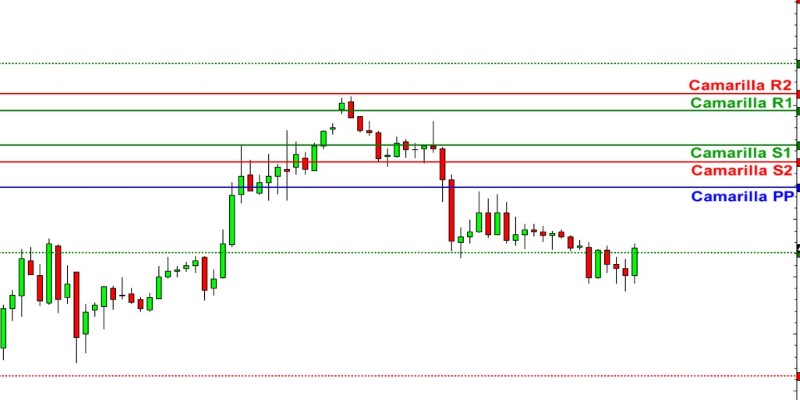
Mastering Camarilla Pivot Points: Strategies for Consistent Trading Success